SDRPlay Independent Community Forum › Forums › SDR Software (RSP Compatible) › Spectrum analyser software › Reply To: Spectrum analyser software
Hi Dan
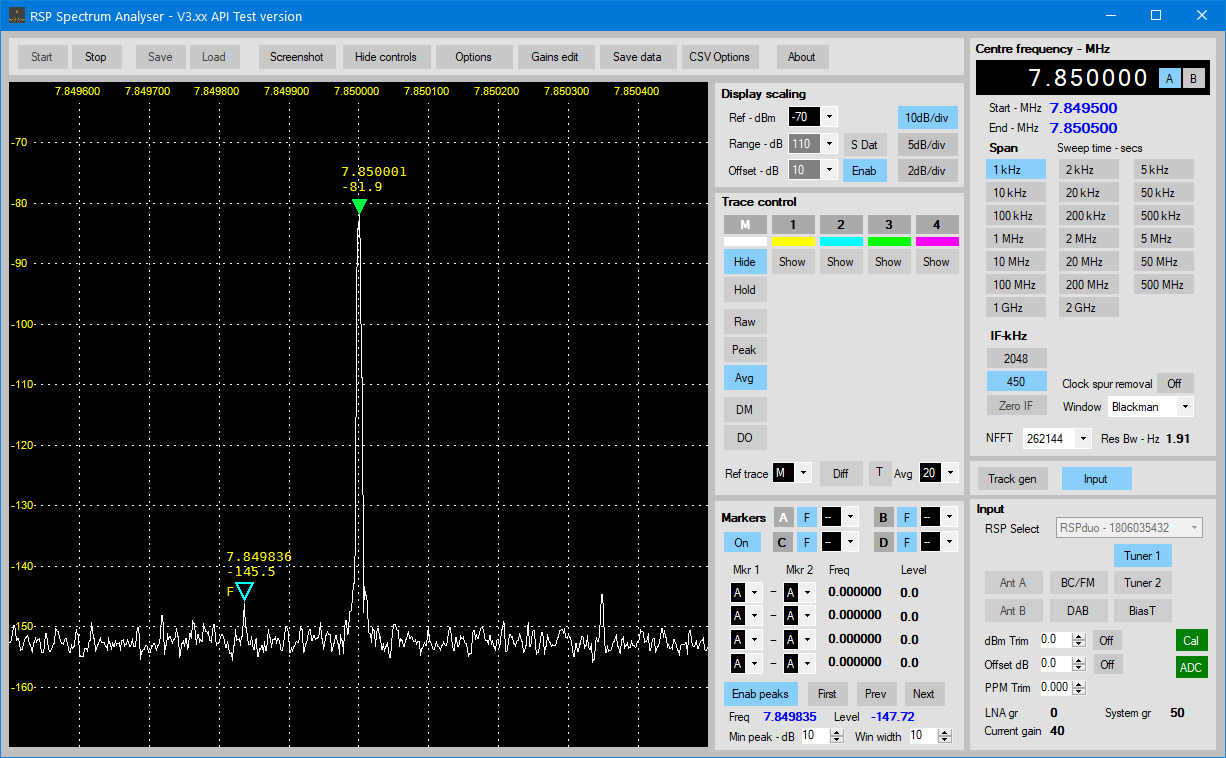
The noise floor of -120dBm as per your attached screen-shot is determined mainly by the reference level setting, and to a lesser extent, by the number of Fourier bins – NFFT. Depending on settings, the noise floor can be as low as -160dBm. No provision is made to select a cutoff level, the CSV data is raw FFT data and has not been manipulated in any way. That is the whole point of such data. It’s then up to the data consumer to do with it what they will. I don’t know how you’re producing the graph, but I would have thought it would be possible to set the range on the X axis and clip the unwanted data, or use a spreadsheet to limit the data range.
Check the attached screen shot. By setting the reference level at -70dBm I’ve lowered the noise floor by around 35dB with an subsequent improvement in the S/N ratio. Check pages 3-5 in the manual. That clearly shows the affect of the reference level on noise floor and S/N.
The frequency resolution has been improved by setting NFFT to 262,144, with resolution bandwidth now at 1.9Hz rather than 15.2Hz. This has increased the frequency resolution by a factor of 8. This could further be improved by setting NFFT to 524,288 which will reduce the resolution to less than 1Hz.
All the best
Steve